Immune Cell Infiltration
Visikol offers contract research services to evaluate the propensity of immune cells to infiltrate 3D cell culture models for immuno-oncology studies
Background
- Presence of Tumor-infiltrating immune cells (e.g. CD3/CD4/CD8/CD45+ T cells) is associated with better prognosis for cancer patients
- Typical analysis involves sectioning of tumor tissue samples and processing for immunohistochemistry (IHC) to label T cells. This method works well but is very low throughput and costly, and as such not amenable to use in screening.
- In vitro assay of immune cell infiltration: monitoring interaction of therapeutic with immune cells in 2D assay format (e.g. Boyden chambers, scratch assay). These models do not replicate the tissue microenvironment and thus do not adequately mimic in vivo conditions for study of immune cell infiltration.
- 3D cell culture models are more biologically relevant and allow for proper assessment of immunotherapies designed to promote immune cell response to tumor cells
- This assay can be utilized to assess effect of compounds and therapeutic antibodies on immune cell infiltration, or to screen immune cell populations for use in immunotherapy.
Protocol
| Instrument | Molecular Devices ImageExpress Micro Confocal |
| Analysis Method | High content screening |
| Markers | DAPI (total cell count) Label for immune cellsViability Dye Other markers available on request |
| Cell Model Type | 3D cell models (e.g. tumor spheroids) |
| Cell Types Available | ATCC cancer cell lines CD3+ T cells Client provided cells |
| Test Article Concentration | Single point assay 8 point assay (20 ug/mL, 10 ug/mL, 2 ug/mL, 1 ug/mL, 400 ng/mL, 200 ng/mL, 100 ng/mL, 20 ng/mL) (custom concentrations available) |
| Number of Replicates | 3 replicates per concentration |
| Quality Controls | Vehicle control |
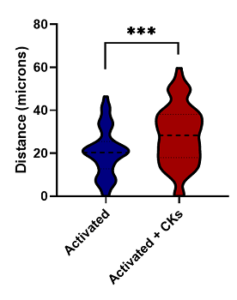
| Data Delivery | Dose response curves illustrating number of infiltrating T cells vs dose of test compound, Total cell counts for each treatment group, Distribution of distance of infiltration for immune cells Evaluation of statistical significance of results with respect to vehicle and treatment groups |
Validation Data
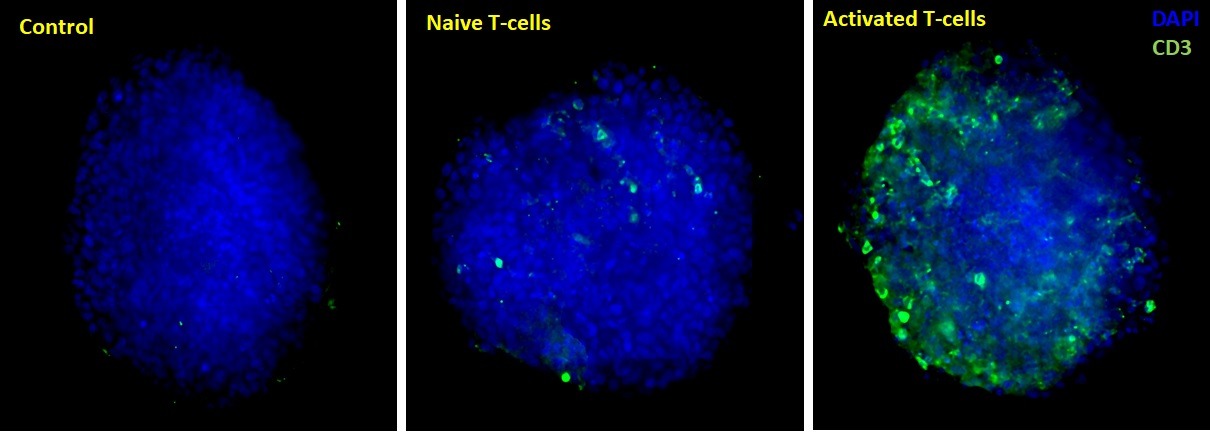
Figure 1. Maximum Z-projection of Z-stack obtained from High Content Imaging of tumor spheroids in the presence of activated and naive immune cells. Data was quantified by automated image analysis to count total number of cells, and number of infiltrating immune cells.
This video depicts a representation of how immune cell infiltration is measured in 3D. Each immune cell is mapped to its position within the 3D cell model and the distance to the boundary is measured. Dark lines indicate cells that are close to the surface, orange/yellow lines depict cells that are far into the interior.
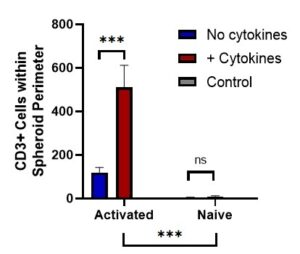
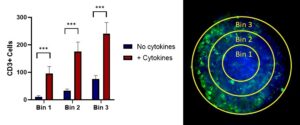
Figure 2. Representative data showing the observed number of CD3+ cells detected within the boundaries of the tumor spheroid, and a breakdown of CD3+ cell counts by location in the tumor spheroid.
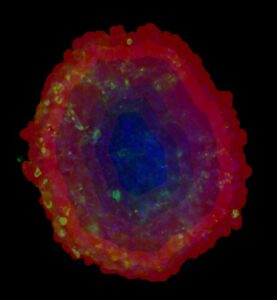
Figure 3. Heatmap overlay depicting relative number of detected CD3+ cells in concentric regions of tumor spheroid.
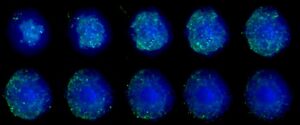
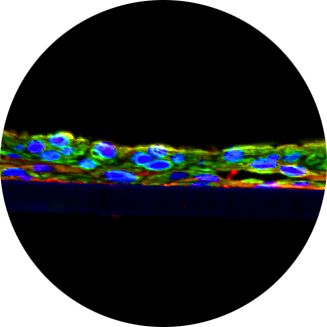
Figure 4. Montage of z slices from confocal stack obtained from cleared tumor spheroid, depicting CD3+ cells in green, and nuclei in blue.