HUREL Micro Liver Services
Metabolite Identification (MetID) Services
HUREL micro livers produce robust metabolite yields that closely correlate to metabolites generated by parent compounds in vivo.
Arrow
Background
- Metabolite identification in in vitro hepatocyte cultures is a fundamental step in drug development to elucidate how a compound is metabolized by hepatic enzymes, predict its metabolic fate, and identify resulting metabolites.
- Primary hepatocytes provide a comprehensive metabolic environment, as they contain both phase I (e.g., cytochrome P450s) and phase II (e.g., UDP-glucuronosyltransferases, sulfotransferases) enzymes, enabling a broad range of metabolic reactions observed in vivo.
- Conventional in vitro systems, such as liver microsomes and suspension hepatocytes, are limited by their incomplete complement of drug-metabolizing enzymes and short-lived metabolic activity, making them less suitable for assessing slowly metabolized compounds.
- Visikol, Inc utilizes the HUREL® micro liver models (primary hepatocytes co-culture with stromal cells), which maintains stable phase I and phase II metabolic functions for more than four weeks.
- These systems provide a more physiologically relevant simulation than microsomes or suspension hepatocytes and generate robust metabolite profiles that closely correlate with those produced by the parent compounds in vivo.
- LC-MS/MS is employed to detect, characterize, and structurally elucidate metabolites formed during hepatocyte incubations.
- Results from hepatocyte-based metabolite identification studies inform drug optimization by revealing metabolic liabilities, guiding medicinal chemistry efforts, and predicting interspecies differences in metabolism and potential toxicity.
General Procedure
- HUREL® micro liver models are prepared by co-culturing primary hepatocytes and stromal cells and cultured for one week prior to dosing compounds.
- Treatment with test compounds
- At each time point, samples are collected for LC-MS/MS analysis.
Protocol
| Cell Model | HUREL® Primary Hepatocyte Micro Liver Models (Species: Human, Primate, Dog, Rat, Mouse, Minipig, Rabbit, etc) |
| Time points | t = 0, 4, 24, 48, 72, 168 hours after dosing (custom time points available) |
| Test Article Concentration | Single point assay (10 µM) (custom concentrations available) |
| Positive Controls | Timolol |
| Number of Replicates | 1-2 replicates per time condition |
| Method | Identification of metabolites |
| Analysis Method | LC-MS/MS |
| Test Article Requirements | 50 µL of 10 mM solution or equivalent amount of solid |
| Data Delivery | LC-MS chromatograms of the parent and metabolites MS/MS spectrum Structural elucidationSummary table |
Data
![Proposed metabolic pathway of timolol [1].](https://www.mattek.com/wp-content/uploads/2025/06/Proposed-metabolic-pathway-of-timolol.png)
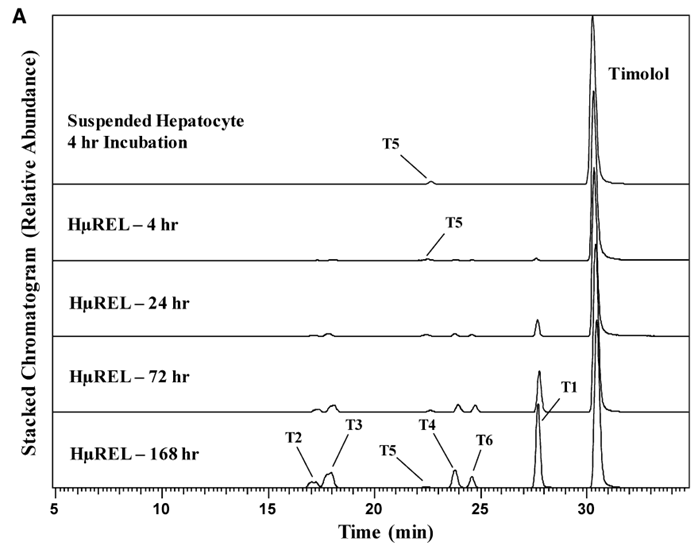
Figure 1. (A) Chromatograms showing the metabolite profile of timolol in human suspended hepatocytes (4 hours) and the HURELhumanPool™ Micro Liver Model (Co-culture of primary hepatocytes/stromal cells). (B) Proposed metabolic pathway of timolol [1].
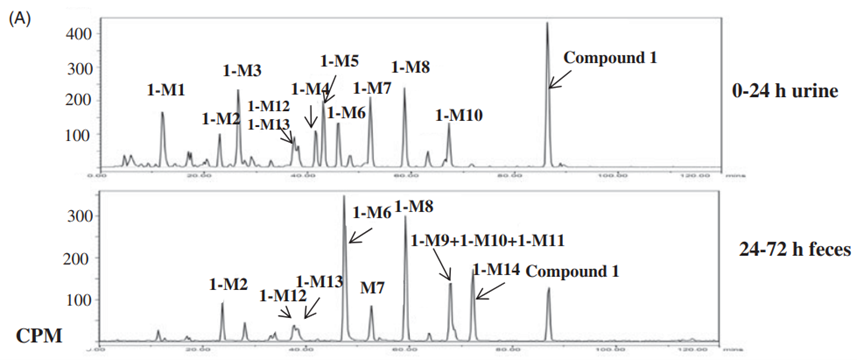
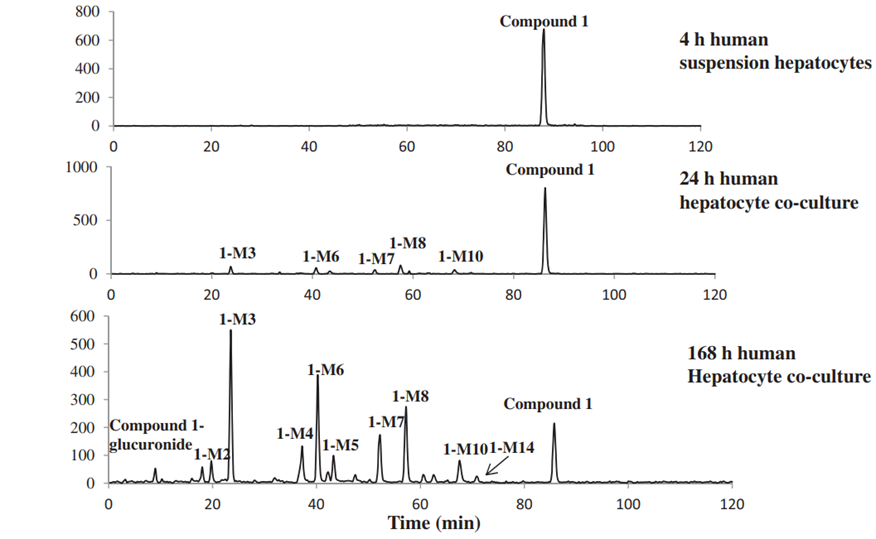
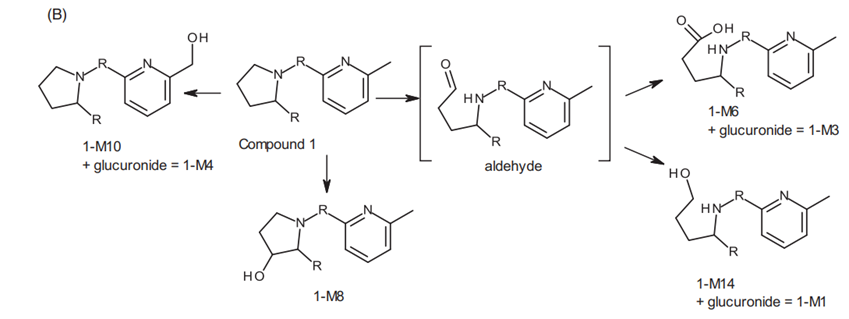
Figure 2. (A) Chromatograms of compound 1 (Eli Lilly) in urine (0-24 hr), feces (24-72 hr), human suspended hepatocytes (4 hours), and the HURELhumanPool™ Micro Liver Model (Co-culture of primary hepatocytes/stromal cells). (B) Metabolic pathways of compound 1 (Eli Lilly) [2].
References
- Burton, R. D., Hieronymus, T., Chamem, T., Heim, D., Anderson, S., Zhu, X., & Hutzler, J. M. (2018). Assessment of the biotransformation of low-turnover drugs in the HµREL human hepatocyte coculture model. Drug Metabolism and Disposition, 46(11), 1617-1625. https://doi.org/10.1124/dmd.118.082867
- Cassidy, K.C. & Yi, P. (2017). Qualitative and quantitative prediction of human in vivo metabolic pathways in a human hepatocyte-murine stromal cell co-culture model. Xenobiotica, Early Online, 1-14. doi:10.1080/00498254.2017.1395927